Historical Tender Data: Your Biggest Bidding Advantage in India 2026
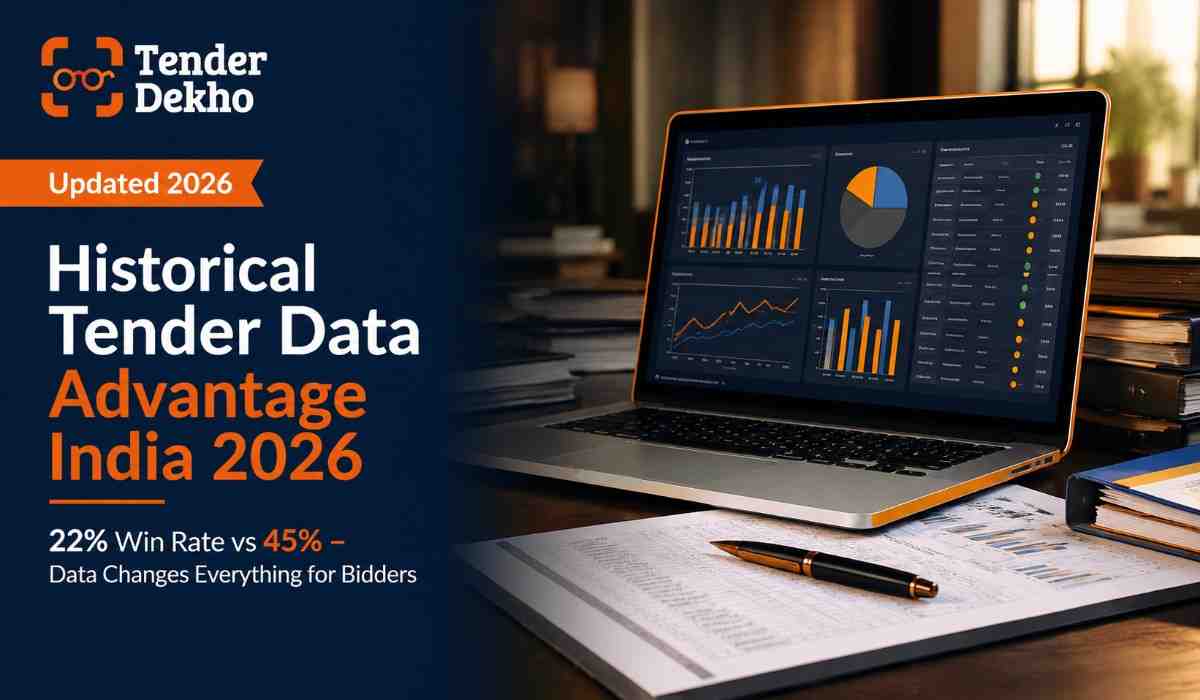
Most businesses treat every government tender like a blank page — researching it from scratch, guessing at pricing, and hoping the competition is light. That approach explains why the overall win rate for qualified bids in India sits at just around 22%, according to TenderDekho industry analysis (2025 data). The remaining 78% of effort produces nothing — no contract, no revenue, just sunk cost.
The companies consistently outperforming that average are not necessarily larger, better-staffed, or more connected. Many are MSMEs. What separates them is one thing: they bid with data, not guesswork. They study what happened in past tenders — who won, at what price, how many bidders competed, and which departments repeat similar procurement cycles. That body of information is called historical tender data, and in India's ₹50–70 lakh crore annual government procurement market (TenderDekho estimates, 2025 data), it is the single biggest source of competitive advantage available to any bidder.
Browse active government tenders with historical insights on TenderDekho
Why Most Bidders Are Flying Blind

India's procurement ecosystem has never been more transparent. The Government e-Marketplace (GeM) crossed ₹5 lakh crore in Gross Merchandise Value (GMV) in FY 2024–25, according to a Ministry of Commerce and Industry release (2025 data). Over 22.5 lakh sellers and service providers are now registered on the platform. Central Public Procurement Portal (CPPP), state e-procurement portals, railways, defence, and municipal bodies together publish lakhs of tenders every year — and they publish the results too.
Yet most vendors treat tender results as irrelevant once a round closes. They move on to the next opportunity without extracting the intelligence sitting right in front of them. This is the gap that data-driven bidders exploit.
Here is what most businesses currently lack when they bid:
- Knowledge of who typically bids in their category and how aggressively they price
- Understanding of which departments release similar tenders on a predictable schedule
- Awareness of the L1 (lowest bid) price range that wins in their segment
- Clarity on which months see peak competition versus low competition
- A record of their own past performance to benchmark improvement
Without this context, pricing a bid is guesswork. Choosing which tender to pursue is instinct. And building a pipeline is reactive rather than strategic.
| What Blind Bidders Do | What Data-Driven Bidders Do |
|---|---|
| Bid on every seemingly relevant tender | Filter tenders by historical win probability |
| Price based on gut feel or floor cost | Price based on L1 benchmarks from past results |
| Discover tenders by accident | Track departments with predictable procurement cycles |
| Treat each loss as a one-off event | Analyse losses to identify disqualification patterns |
| Spread effort across many categories | Focus on 3–5 categories where data shows advantage |
Strategy 1: Use Historical Pricing to Stop Overbidding and Underbidding
Pricing is where most tenders are won or lost — and it is also the area where historical data delivers the most direct value.
In government procurement, the winning bid is almost always the L1 (Lowest Bidder 1). The evaluation methodology — whether Least Cost Selection (LCS) or Quality and Cost-Based Selection (QCBS) — ultimately rewards competitive pricing for equivalent quality. The problem is that the winning price range is a moving target. What wins one construction tender in Maharashtra may be very different from what wins a comparable tender in Telangana, or from the same department six months later.
Historical bid result data solves this by showing you the actual L1, L2, and L3 prices from past tenders in your category. From this you can calculate:
- The typical L1 margin: how far below the estimated value the winner usually bids
- The L1–L2 spread: how tight or loose the competition is at the top
- The floor price: how low bids go before they likely reflect quality risk
- Seasonal price compression: whether Q4 (Jan–March) bids are more aggressive than Q1
This removes the two most costly pricing errors in bidding:
- Overbidding: pricing above the likely winning range and losing consistently despite eligibility
- Underbidding: pricing so low that you win but cannot profitably execute — a particularly dangerous trap for MSMEs on tight margins
For MSMEs specifically, the margin protection dimension of historical pricing is critical. According to analysis by procurement intelligence platforms (2026 data), many small businesses win contracts at prices that do not cover their actual delivery costs, because they underbid to secure their first few contracts. A historical view of what the market actually pays prevents this.
Source: GeM portal bid result data analysis, 2025
| Price Intelligence Input | How to Use It |
|---|---|
| L1 from past 5 similar tenders | Set your target price range |
| L1–L2 gap analysis | Decide how narrow your pricing buffer needs to be |
| Department-specific discount patterns | Build negotiation reserve into initial price |
| Category price trend (quarterly) | Time your bids for lower-competition windows |
| Your own historical win/loss prices | Calibrate margin versus win probability |
Source: Aggregated public procurement result disclosures, GeM and state portals, 2025 data
Find tenders updated daily across all categories on TenderDekho
Strategy 2: Map Procurement Cycles to Plan Your Bidding Calendar
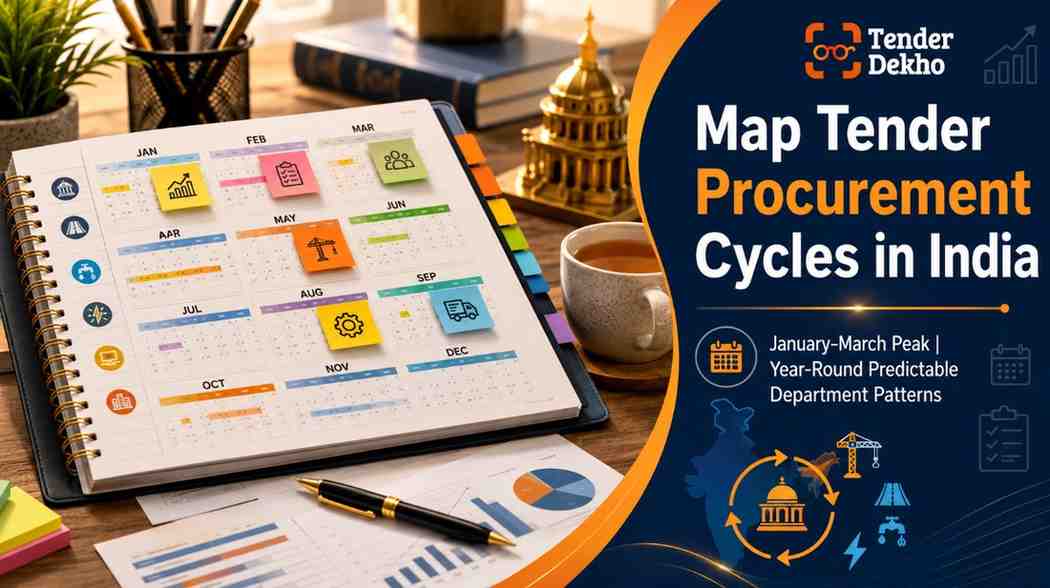
Government procurement in India follows observable patterns. Budgets are approved, procurement plans are set, and departments tend to float similar tenders at similar times every year. Understanding these cycles turns your bidding from reactive to planned — which reduces cost per bid and increases preparation quality.
Year-end surge: The January–March window consistently sees elevated tender volume as departments spend allocated budgets before the fiscal year closes. According to TenderDekho's state-level historical analysis of Rajasthan (2025 data), February alone captured 52.1% of annual tender volume in the state — a pattern repeated in varying degrees across most states and central departments.
Department-specific cycles: Central ministries like Defence, Railways, Health, and Education release procurement on schedules tied to their operational and capital expenditure plans. Departments that procure medicines, consumables, or maintenance services tend to issue Annual Maintenance Contract (AMC) and Rate Contract tenders at predictable intervals — typically at the start of each financial year.
Category seasonality: Construction and civil works tenders peak before monsoon season (February–April) and after it (October–November). IT and equipment tenders often cluster around budget release in Q2 (July–September).
When you map this historical calendar for your specific target departments and categories, you can:
- Prepare documentation and certifications well before peak cycles
- Allocate your bid team bandwidth in advance rather than reacting to last-minute deadlines
- Build financial reserves (for EMD where applicable) ahead of high-volume periods
- Avoid overbidding during competitive Q4 windows and price more aggressively in low-competition mid-year periods
MSMEs benefit especially from cycle mapping because they typically have smaller teams. A planned calendar means one person can manage the full bid pipeline instead of firefighting new opportunities every week.
| Procurement Cycle | Typical Peak Months | Key Categories |
|---|---|---|
| Year-end budget flush | January – March | Works, supplies, services |
| Post-Budget release | July – September | IT, equipment, infrastructure |
| Pre-monsoon construction | February – April | Civil works, roads, buildings |
| Annual contract renewals | April – June | AMC, manpower, housekeeping |
| Defence and Railways procurement | Spread across Q1–Q3 | Equipment, spares, logistics |
Source: TenderDekho procurement cycle analysis, 2025 data
Strategy 3: Build Competitor Intelligence from Past Results
Every time a government tender result is announced, it tells you something valuable: which companies competed, what they bid, and who the department trusted enough to award. Over time, this builds a picture of the competitive landscape in your category that no amount of networking can replicate.
According to TenderDekho's homepage data, 96% of top-performing companies use competitor intelligence for tender success (2025 data). The gap between top performers and average bidders in India is not primarily about technical capability — it is about knowing who else is in the room before you decide whether to enter.
Here is what consistent analysis of tender results reveals about your competitors:
- Pricing behaviour: Do they always go for L1 at thin margins, or do they bid mid-range and win on technical scores?
- Department relationships: Are there departments where the same company wins repeatedly? That signals either deep relationships or superior category expertise — both of which should inform your decision to compete or avoid.
- Category focus: Which specific categories does each competitor dominate, and where are they stretched thin?
- Win rate trends: Is a competitor on an upswing or downswing? A company losing recent contracts may be in financial or operational stress — creating an opening.
- Geographic concentration: Strong in one state but thin elsewhere? Regional presence you already have may outweigh their category depth.
For MSMEs, this intelligence is especially valuable because resources are limited. Before spending ₹50,000–₹2 lakh on bid preparation (documentation, DSC fees, EMD where applicable, compliance certifications), knowing whether three established incumbents dominate the category can save you from entering unwinnable contests.
A realistic example: a small IT services company analysing past tender results in the ₹20–40 lakh range for a specific software maintenance category identifies that only 2–3 companies typically bid. Competition is thin because the category requires a niche certification. They build that certification, enter the market, and within a year win 12 contracts worth ₹3.2 crore. This is the direct payoff of competitor intelligence mapped from historical data.
| Competitor Signal | What It Means for You |
|---|---|
| Same vendor wins same department 3+ times | Strong relationship — consider a different department |
| L1 always 30%+ below estimate | Possible predatory pricing or overheads advantage — check your cost structure |
| No repeat winner in last 8 tenders | Open market — your credentials alone may be enough |
| Large firms dominating tenders under ₹25 lakh | Opportunity gap — they may not find small contracts worthwhile |
| MSME winners dominating a category | MSME reservation or preference active — check your eligibility |
Source: TenderDekho industry analysis and procurement result patterns, 2025 data
Explore government procurement tenders filtered by category and value
How MSMEs Can Extract Maximum Value from Historical Data
MSMEs have a structural advantage in historical data analysis that large companies often overlook: they can be more selective. A large contractor bidding for pipeline coverage must pursue volume. An MSME bidding strategically can focus entirely on the 10–15 opportunities per year where historical data signals the highest probability of winning.
Vendors focusing on 3–5 closely related categories achieve 34% higher win rates than those spreading across many categories, according to GeM vendor data analysis (2025 data). That focus is only possible when you know which categories your track record, pricing, and certifications align best with — knowledge that comes directly from reviewing your own historical bid performance.
Steps for MSMEs to start building their data advantage:
- Audit your past bids: For every tender you have submitted in the last 12 months, record the result, your price, the L1 price (usually published in the portal), and the number of bidders. This is your baseline.
- Identify your win categories: Which categories or departments did you win in? What was your pricing versus L1? Build a profile of your competitive sweet spot.
- Map your loss reasons: Was it price, disqualification, or technical score? Documentation errors cause 35% of bid disqualifications according to GeM data (2025 data). Many losses are preventable.
- Research target competitors: Choose the 3–5 companies you compete against most frequently and build a simple profile of their pricing pattern and department focus.
- Set a data review cadence: Every month, update your records with new results from your target departments. Over six months, patterns become clear.
Udyam-registered MSMEs also have access to MSME-reserved categories and EMD (Earnest Money Deposit) exemptions under General Financial Rules (GFR) 2017, saving ₹50,000 to ₹10 lakh per bid depending on tender value. Historical data helps you identify which reserved tenders have consistently low competition — maximising the value of these structural benefits.
For GeM-registered vendors, TenderDekho's GeM services provides tools to track historical bid outcomes and identify the highest-probability opportunities across service and product categories.
| MSME Data Advantage Checklist | Status |
|---|---|
| Past 12 months of bids logged with L1 comparison | ✅ Must-have |
| Win category profile built (top 3 categories) | ✅ Must-have |
| Loss reason analysis completed | ✅ Must-have |
| 3–5 target competitors profiled | ✅ Must-have |
| Procurement cycle calendar mapped for target departments | ✅ Must-have |
| Udyam registration active for MSME-specific data insights | ✅ Must-have |
| GeM seller account with historical order tracking enabled | ⚠️ If GeM-active |
| State portal result monitoring set up | ⚠️ If state-focused |
Making Historical Data Actionable: A 30-Day Plan
Knowing the value of historical tender data and actually using it are two different things. The following plan converts the concept into a repeatable practice for any bidder — MSME or enterprise.
| Week | Actions | Output |
|---|---|---|
| Week 1 | Pull last 12 months of your own bid records. Note result, your price, L1 price, bidder count for each. | Personal performance baseline |
| Week 2 | Research past results for your top 3 target departments. Identify L1 ranges, repeat winners, average bidder counts. | Competitor and pricing intelligence snapshot |
| Week 3 | Map the procurement calendar for your target departments. Identify peak months, AMC renewal cycles, and quiet periods. | 12-month bidding calendar |
| Week 4 | Apply findings to next 3 bids: adjust pricing based on L1 benchmarks, shortlist only high-probability tenders, pre-prepare documentation for peak periods. | First data-informed bid pipeline |
After 90 days of this practice, you will have a live intelligence file that sharpens with every new result. The cost is time — not money. The benefit is a measurably higher win rate.
Discover government tenders matching your profile on TenderDekho
Frequently Asked Questions
What is historical tender data and where do I find it?
Historical tender data refers to the results of past procurement rounds — who won, at what price, how many companies competed, and which department issued the tender. In India, this data is publicly available through:
- GeM portal result announcements at gem.gov.in
- CPPP (Central Public Procurement Portal) at eprocure.gov.in
- State e-procurement portals (each state has its own portal)
- RTI (Right to Information) disclosures for awarded contract details
- Tender aggregation platforms that compile results across portals
Is historical tender data useful for MSMEs or only large companies?
It is arguably more useful for MSMEs. Large companies can absorb losses from poorly selected tenders. MSMEs cannot. Historical data helps MSMEs avoid unwinnable contests, focus on reserved categories where competition is lighter, and price correctly in categories where they have a structural advantage through EMD exemption and price preference benefits.
How far back should I look at historical data?
For pricing benchmarks, the last 6–12 months is most relevant because market conditions shift. For identifying competitor patterns and departmental relationships, 18–24 months gives a clearer picture. Older data is useful for cycle mapping — identifying whether a department issues similar tenders every April, for example — but less reliable for pricing guidance.
Does analysing past tenders give a bidder an unfair advantage?
No. All tender results in India are publicly available and government transparency policies actively encourage their use. Procurement transparency rules require result disclosures precisely so the market can function efficiently. Using publicly available data to make better decisions is responsible procurement participation, not manipulation.
What does an MSME need to access reserved-category historical data?
- Udyam registration (free, at udyamregistration.gov.in)
- GeM seller registration (for GeM-specific data)
- A login on your relevant state e-procurement portal
- Access to a tender aggregation platform that tracks results across portals
Can historical data help if I am bidding in a new category?
Yes — and it is especially important in that case. Before entering a new category, review past results to understand the typical number of competitors, the L1 price range relative to estimates, and whether any single vendor dominates. This tells you whether the category is worth entering before you spend on certifications and registration. Browse government tenders across all categories to assess competition levels.
Conclusion

The 22% average win rate for qualified government bids in India is not a ceiling — it is a baseline for bidders who compete without data. The companies holding 35–45% win rates in the same market are not operating with fundamentally different capabilities. They have simply learned to treat past tender results as a strategic asset rather than irrelevant history.
Historical tender data tells you what price wins, who competes, when to bid, and where competition is thinnest. Applied consistently across pricing, competitor profiling, and cycle planning, it shifts bidding from reactive to intentional — and that shift compounds over time.
For MSMEs in particular, this approach requires no large investment. Your 12-month bid log, your target department's result archive, and a clear view of 3–5 competitors is enough to start making meaningfully better decisions in your next tender round.
Start with the tenders you already know. Find government procurement opportunities across India on TenderDekho — and use the platform's historical insights to find the opportunities where your chances are highest. For further reading on procurement strategy, visit the TenderDekho blog and guides hub for sector and state-specific analysis.