
You Keep Losing Tenders — And You Do Not Know Why
It is 4:30 PM on a Thursday, and your estimator has just received the bid result for a ₹6.2 crore NHAI package in Maharashtra that your team spent three weeks preparing. You came in at ₹5.97 crore. You were L3. The winner bid ₹5.61 crore — 6.1% below your figure.
Your first instinct is to wonder whether you mispriced it. But which part — the labour rates? The material cost index? The overhead allocation? You have no way to know, because all you have is a single number — the L1 figure — and no context around it.
Now consider that this same company has been winning against your team in the same geography for two years. You have lost four tenders to a firm you cannot identify, whose pricing approach you cannot study, and whose geographic focus you cannot map. You are not losing to a better company. You are losing to a company you know nothing about.
This is the silent drain in government procurement for thousands of Indian MSMEs and infrastructure firms. The public sector publishes more than 2 crore tender records — each one a data point about who bid, who qualified, who won, and at what price. That data exists and is accessible. But no single business can manually compile it, cross-reference it, and draw actionable conclusions in time to influence the next bid.
The problem is not that you are bidding in the wrong places. The problem is that you are bidding without intelligence. You do not know which competitors consistently target your key departments. You do not know where your qualification rate drops against specific firms. You do not know whether Maharashtra is genuinely a strong state for your business, or whether one well-positioned competitor is quietly dominating that territory while you bid on volume and hope.
A ₹6 crore bid takes three weeks to prepare. An avoidable 4% pricing miss costs ₹24 lakh on a contract you were otherwise capable of winning. Multiply that across 12 bids a year and the number becomes ₹2–3 crore in preventable losses — not from poor work, but from bidding blind.
Why Your Current Research Methods Are Not Giving You What You Need
Most procurement teams respond to repeated losses by trying harder at one of three things — and none of them surfaces the intelligence that actually changes outcomes.
Asking peers and industry contacts about competitors. Word-of-mouth sharing is selective, delayed, and imprecise. Contacts share general impressions — "Alpha Constructions is very aggressive in Maharashtra" — but cannot tell you Alpha's exact qualification rate, the value bands they target, or the specific departments where they concentrate their bids. By the time you receive anything useful, the opportunity is already past.
Manually downloading and cross-referencing bid results from portals. Result documents are available on most state portals. The problem is format inconsistency — some portals publish PDFs, others HTML tables, others only summary-level results. Compiling even one competitor's 12-month bid history across five portals takes days of manual extraction. Doing this systematically for six competitors every quarter is not feasible for any team under 20 people.
Using company registration databases such as MCA or GSTIN portals to research competitors. These sources tell you a company's paid-up capital and registered address — nothing about their bid history, win rate, department focus, or actual pricing behaviour in government tenders. They are useful for due diligence, not for competitive strategy.
Reviewing the one result PDF released per tender. Most businesses read the result notice when they receive it — note the L1 price, file it, and move on. This gives you one data point per tender, with no accumulated view across bids, competitors, geographies, or time periods. Patterns cannot emerge from isolated data points.
What procurement teams need is not better research methods. They need a system that has already compiled the data, across every portal, for every company, going back eight years — and can surface the specific insight relevant to the next bid on the desk.
How TenderDekho's Competitor Intelligence Dashboard Solves This

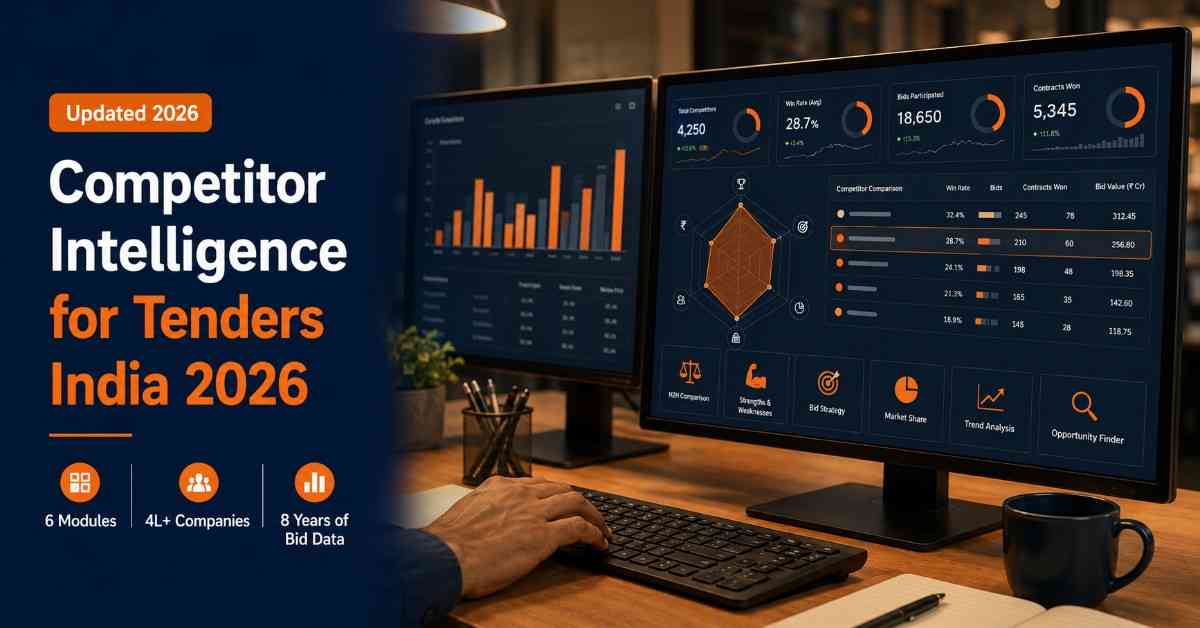
TenderDekho's Competitor Intelligence Dashboard gives your business six dedicated intelligence modules — covering your own performance metrics, head-to-head competitor comparison, full results history, a 4-lakh+ company directory, state and city-level analysis, and AI-generated threat and opportunity insights.
The dashboard aggregates data from 2 crore+ tender records across 8 years of Indian government procurement, covering 4 lakh+ companies across 28 states and every major ministry. Every module is built around one purpose: turning raw procurement data into a decision your team can act on before the next bid submission.
Here is what the six modules deliver:
- Your Performance Dashboard — total bids, qualification count, win count, win value, and win rate segmented by ministry, department, state, city, category, and value band
- H2H Competitor Intelligence — identifies companies that have bid in the same tenders as you, compares Q rate and win rate side-by-side, and visualises the competitive gap in an interactive radar chart
- Tender Results History — complete record of every tender you participated in: L1 winner, winning bid amount, total bidder count, full L1-to-Ln ranking, and average price gap
- Company Directory — search 4 lakh+ companies by name, GSTIN, PAN, state, or category; open any profile to see bid history, win history, tender segments, paid-up capital, and registration type
- Location Intelligence — drill into state and city-level activity, compare your win rate against market average and specific competitors in each geography, identify low-competition expansion targets
- AI Threat & Opportunity Analysis — processes your full bid history and competitor data to generate a Market Overview, Threat Score, Market Opportunities list, and a tailored Growth Strategy
| Without Competitor Intelligence | With Competitor Intelligence |
|---|---|
| No knowledge of who you bid against | Full H2H competitor profiles with 8-year win data |
| Pricing based on cost estimates alone | Benchmarked against 2 crore+ actual declared results |
| Lose segments without understanding why | AI threat scoring identifies exact competitive risk |
| Geographic expansion based on guesswork | Location intelligence maps untapped low-competition states |
| Manual portal-by-portal results research | All results consolidated in one continuously updated dashboard |
Explore the Competitor Intelligence Dashboard on TenderDekho and see exactly how your win rate compares to the market in your key categories and states.
Step-by-Step: How to Use All Six Modules

Here is the complete setup and analysis flow for the Competitor Intelligence Dashboard.
Step 1 — Open the Dashboard and Set Your Performance Baseline
- Log in to your TenderDekho account and navigate to Competitor Intelligence in the main navigation.
- What you see: Your performance summary — Total Bids, Qualified Count, Total Wins, Win Value, Win Rate, and Q-W Rate
- Apply segment filters using the Ministry, State, Category, and Value Band dropdowns to see your performance in the specific segment you want to analyse.
- Note your baseline win rate in your primary category. This is your reference point for all competitor comparisons in the next steps.
Tip: Start with the category and state where you bid most frequently — not where you win most. Your high-volume, lower-win-rate segment is usually where competitor analysis produces the most immediate improvement.
Step 2 — Run an H2H Competitor Comparison
- Navigate to H2H Competitor Intelligence in the left module panel.
- The system automatically surfaces companies that have bid in the same tenders as you, ranked by frequency of overlap.
- Select up to five companies to add to your comparison using the Add to H2H button.
- What you see: a side-by-side table showing Bids, Q Rate, W Rate, and Bid Value for each company vs your baseline, plus an interactive Performance Radar Chart.
Tip: The Q Rate gap is often more actionable than the win rate gap. A competitor with a 41% Q rate is failing at technical qualification — they are not a pricing threat. Focus your analysis on companies with Q rates above 80% who are also winning at a rate close to or above yours.
Step 3 — Review Results History and Build a Pricing Benchmark
- Open Tender Results History from the module menu.
- Use the Wins Only filter to review your successful bids — note the average bidder count and your typical winning margin above L2.
- Switch to All Participated to review losses — identify the average price gap between your submission and L1 across each state and ministry.
| Filter View | What to Look For |
|---|---|
| Wins Only | Your average winning margin and typical bidder count |
| All Participated | Your average L2-to-L1 price gap on lost bids |
| By State | Win rate variance across states in the same category |
| By Ministry | Departments where your win rate consistently exceeds average |
Step 4 — Research Any Competitor in the Company Directory
- Navigate to Company Directory and search by company name, GSTIN, or state.
- Open any profile to view: total bids, win count, win rate, top ministries, top states, bid value range, paid-up capital, and registration type.
- Use the Category Filter to find all companies with strong win histories in the same segment as your next bid.
Step 5 — Run the AI Threat and Opportunity Analysis
- Navigate to AI Threat & Opportunity Analysis from the dashboard module menu.
- The AI generates four outputs — review them in order:
- a. Market Overview — your current position vs sector average win rate and bid volume
- b. Threat Analysis — competitor risk scores showing which companies pose the highest threat to your primary segment
- c. Market Opportunities — segments with strong tender volume where your historical win rate pattern suggests a competitive fit
- d. Growth Strategy — AI-recommended next actions: which states to expand into, which competitors to study, which value bands to target
- Export the full report using the Export Report button — available as CSV or PDF for internal presentation.
Access competitor bid data and AI threat scoring on TenderDekho — the full six-module dashboard is accessible from your first login, with 8 years of historical data available from day one.
Real-World Example: How a Pune Contractor Broke a Three-Year Stagnation
Consider a Pune-based civil works contractor bidding on PWD and NHAI road projects across Maharashtra and Karnataka. Their win rate had been flat at 28% for three consecutive years. The team assumed they were priced correctly and attributed losses to the tendering authority's preferences or competitor relationships.
After activating the Competitor Intelligence Dashboard:
- Performance Dashboard revealed their Maharashtra win rate was 34% — but Karnataka win rate was only 11%, despite similar bid volumes in both states
- H2H Analysis identified a Bengaluru-based firm that had bid against them in 23 direct tenders — with a Q rate of 89% and win rate of 52%, nearly double theirs in that geography
- Results History showed their average price gap on Karnataka losses was 8.3% — far above their 3.1% average gap on Maharashtra losses, confirming a structural pricing mismatch in that state
- Location Intelligence identified four Karnataka cities with strong PWD tender volume and no dominant competitor above 40% win rate — legitimate expansion targets with lower competitive pressure
- AI Threat & Opportunity Analysis flagged the Bengaluru competitor as a High Threat in their category, and identified PWD Rajasthan as a Market Opportunity — a geography with equivalent tender volume but no concentrated rival in their segment
Active tenders in Maharashtra and Karnataka government tender opportunities were both visible in the Location Intelligence module from the first session.
| Metric | Before Dashboard | After Dashboard |
|---|---|---|
| Overall win rate | 28% | Improvement targeted |
| Karnataka pricing gap | Unknown | 8.3% identified |
| Primary threat competitor | Unidentified | Bengaluru firm, 52% WR |
| Geographic expansion targets | None | 4 low-competition Karnataka cities |
| New segment opportunity | None | PWD Rajasthan (AI-recommended) |
Frequently Asked Questions
How current is the data in the dashboard?
The dashboard draws from 2 crore+ tender records updated continuously from 55 portals. Historical data spans 8 years, giving you enough longitudinal depth to identify sustained competitor patterns. Results for recent tenders typically appear within 24–48 hours of portal publication.
Can I track a competitor I have never directly bid against?
Yes. The Company Directory holds 4 lakh+ profiles searchable by name, GSTIN, PAN, state, or category. You do not need to have shared a bid with a company to access their full profile, bid history, and win record across any ministry or state.
How accurate is the AI Threat and Opportunity Analysis?
All AI outputs are derived from actual bid and result data — not market projections or surveys. Threat scores are calculated from real head-to-head overlap, Q rate, and win rate patterns across 8 years of records. The AI does not predict future tender outcomes; it provides the most data-grounded basis available for deciding where to focus and where to price competitively.
How many competitors can I compare simultaneously in the H2H module?
The radar chart supports up to five companies in a single comparison, including your own baseline. You can switch companies in and out of the view and save named watchlists of competitors you track regularly.
Can I export the reports for internal use?
Yes. Every module supports export as CSV or PDF via the Export Report button — including your performance metrics, H2H comparison tables, results history, and the full AI threat and opportunity report.
Does Location Intelligence cover all states, or only the larger ones?
Location Intelligence covers 28 states with full win rate and bid volume analysis at state and city level. You can drill into district-level activity in high-volume states and compare your performance to the market average and to specific named competitors in each geography.
Know Before You Bid — Start With Eight Years of Data
Procurement teams that win consistently in government tenders do not just bid harder — they bid on better information. They know which competitors to take seriously, which geographies to prioritise, where their pricing needs to sharpen, and where untapped opportunities are waiting with lower competitive pressure. The Competitor Intelligence Dashboard puts all six of those intelligence layers into a single, continuously updated view.
Discover the full Competitor Intelligence Dashboard on TenderDekho today — your H2H analysis, results history, and AI insights are available from first login, with 8 years of historical data accessible from day one.
For more procurement strategy guides — from alert configuration to GeM registration — visit the TenderDekho procurement blog. If your team needs help setting up the dashboard for your specific category, state, and competitor watchlist, the TenderDekho support team responds within 24 hours.